Knox Stories
Kansas City PIE Trip Takes Students on a Tour of Alumni Success
The group spent four days, from March 13 to 16, 2024, visiting multiple alumni network locations and learning about their work.

Office of Communications
2 East South Street
Galesburg, IL 61401

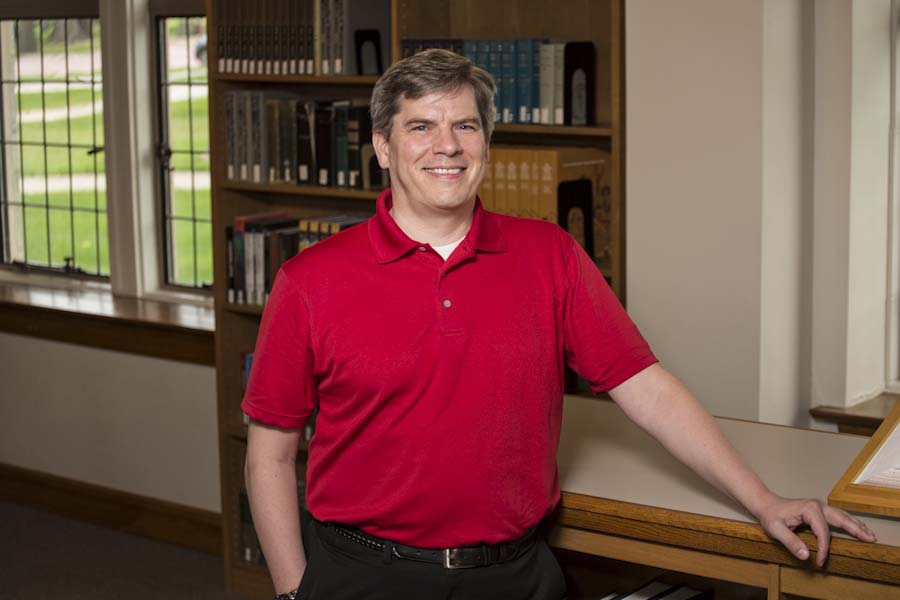
Just one day after the 2016 presidential election, Knox College Assistant Professor of Mathematics Ole Forsberg published an article titled "Reports of the Death of Polling Have Been Greatly Exaggerated." The article appeared in The Conversation.
Even though the election results surprised many people, the polls worked the way they were supposed to, Forsberg wrote. "If there was a problem, it was in how they were used—and the fact that we all forgot they deal in probabilities and not certainties," he added.
Here, Forsberg answers a few questions about polling and his work at Knox.
Q: Is it accurate to call you an expert on polling, especially in connection with elections?
A: An expert on polling? Polling is an incredibly vast area, ranging from determining optimal question wording to estimation for complicated sampling schemes. I do not think anyone could be an expert on every aspect of polling. In terms of polling, I have made a small niche for myself in finding a way to combine multiple polls to obtain better estimates of voter preference. There are many polls taken, especially during a presidential election cycle. I try to find ways of combining those polls to increase accuracy and precision.
My primary area of research interest lies in remote detection of voting unfairness. Clearly, vote fraud is an example of this unfairness. Most current techniques for detecting vote fraud consist of observing elections. However, it is difficult to observe all polling places. It is also difficult in some countries to observe the counting process. To complement election observers, I search the election results for evidence of large-scale fraud.
Unfairness also consists of things like unfair ballots. For instance, if the writing is too small, the ballot is unfair to the elderly. If it is written in one language, it is unfair to those who do not understand that language. If the ballot is complicated, it is unfair to other segments of the population. If the country wants their election to be "free and fair," then the ballots themselves must be fair for all segments of the population.
Q: What is it about polling that appeals to you as a subject to be researched and analyzed?
A: One thing I love about polling is that each poll is a blurry snapshot in time. Each tells us exactly about the group who answered the polling questions. However, each only catches a glimmer of the truth, of what the voters desire. Taking this flawed information and finding its value is a very rewarding experience.
This election cycle was even more interesting, because polling has gone through a major change since 2012. In 2012, we discovered that only calling landline telephones gave estimates that were skewed towards conservative voters. In 2016, having learned our lessons, we tried many different ways of sampling from the American voter. In other words, we did not have an answer, but we knew to try many techniques like calling cell phones (more expensive) or using online polls (high bias). On election day, after four years of wondering what we should do, we were given the answer. Now, we just have to go over the data to see which method gave the best estimates.
Q: How has your polling expertise played a role in your work with students?
A: At a basic level, polling is completely understandable by students. It serves as a hook for some to see the usefulness and beauty of statistics. At the same time, they see the complexity involved in creating those estimates. Back at Oklahoma State University [where Forsberg was a visiting assistant professor of statistics before coming to Knox], I had a couple students working on polling estimation with me for the 2012 election. In 2020, I expect the same thing will happen here [at Knox].
Q: You created a model for presidential elections. Can you describe your model and how you created it? And how accurate was it?
A: The model started out as a "just to kill time" project back in early summer 2012. I originally was trying to develop a method for combining proportion estimates to obtain a better estimate. When there is no change in the true proportion, this is very easy: Average the estimates. The difficulty enters when that true proportion changes. The 2012 election became my source of real data and—ultimately—the correct answer. The true proportion I was estimating was Romney's support in each state. That varied as the election cycle continued, so I was estimating a moving target. The polls were just estimates of that target...sometimes excellent estimates, other times poor estimates.
Your question on accuracy is interesting. My answer depends on how you define accuracy. In my model, each state has a certain probability of voting for each candidate. If I "call" a state for the candidate with a probability of 50% or more, then a lot of richness is missed. However, by that definition, I missed one state in 2004 (Wisconsin), in 2008 (Indiana), and in 2012 (Florida). In 2016 (as of right now), I missed Nevada, Wisconsin, and Pennsylvania.
If, however, we take into consideration that I estimated the probability of Trump winning Pennsylvania at 49.2%, then may not think that Pennsylvania was a miss; it was little more than a coin flip. Similarly, my model estimate the probability Trump winning Wisconsin as 46.1% and Clinton winning Nevada as 49.6%. It estimated the probability of Trump winning the Electoral College as 19.7%. The estimated probability of Trump winning was akin to that of getting two heads on two flips of a coin.
Q: There seems to be a common belief that the "polls were wrong" regarding the presidential election. What are your thoughts on that?
A: There is always a common belief that the polls are wrong. That is because they are "wrong." No poll ever had Clinton winning the popular vote by exactly 0.3%. A couple had the popular vote tied. A few had Trump ahead. Many had Clinton ahead. None were exactly right.
In other words, there is an expectation in the media and the people that polls must predict the exact outcome. But, that is not a realistic expectation. Every aspect of polling has a probability distribution attached to it, starting with who is polled. Two polls that are identical in every other way will give different estimates if they call different people. This inherent randomness seems to be poorly understood by many.
In addition to this, there is something I call the "ESPN Effect." Announcers at the game have a lot of dead air to fill. So, they talk. They fill the time with a lot of meaningless "statistics." Examples include "This team has never lost after being ahead by 10 points at the half" and "This team has not lost a Thursday night November game in 25 seasons." While they are true statements, they have almost no meaning without additional context. They are just words to fill the empty space.
Many journalists do the same with poll results. For instance, they may say something like "Clinton has increased her lead among college-educated white women over last week by 3%." Without knowing the level of uncertainty (the margin of error) in that estimate, it is semantically null. It is entirely meaningless, because that margin of error is most likely much larger that 3%, which means the difference may just be due to random fluctuations from one sample to the next.
Q: In the Comments section of your article in The Conversation, you mention the 2016 election has some parallels with the 2004 Bush-Kerry election. Can you briefly explain?
A: In the 2004 election, the polls tended to have Kerry ahead in the last week. From this, many thought that Kerry would easily be elected. However, the polls also showed a trend in rising polling numbers for President Bush. This trend hinted at the Bush reelection. The same thing happened here. On the graphic in the article you mention, you can easily see the support for Clinton waned over the final week of the election cycle—the movement in the polls was in favor of Trump. This was borne out in the election results.
Q: Is there anything that people (regular citizens, journalists, whoever) can do to better understand polls and evaluate their quality?
A: As I have said elsewhere, if we are going to write about polls, we need to understand them. Journalists need to take a statistics (and probability) course. That will help them place the poll results in a better context for their readers. Journalists also need the freedom to write that the polls do not show changes. From reading the media reports of polls over the past several years, it appears that they are compelled to report the results of a poll and fill space. Just as it would be nice for sportscasters to stop talking and just let us watch the game, it would nice for journalists to be able to say: "There is nothing new in this poll."
Published on November 11, 2016
 One thing I love about polling is that each poll is a blurry snapshot in time."-Ole Forsberg


https://www.knox.edu/news/knox-professor-sheds-light-on-polling-and-election-2016
Printed on Wednesday, April 24, 2024